The quality of life of the population based on. Individual components of the level and quality of life. Existing approaches to assessing the quality of life of the population in Russia
The ultimate goal of people's labor activity is to satisfy their diverse needs. To characterize the level of development and the degree of satisfaction of the material, spiritual and social needs of citizens (in food, housing, services, education, health care, etc.), the concept of standard of living is used.
The standard of living is a complex concept, it is the degree of satisfaction of people's needs, corresponding to the achieved stage of development of the productive forces and production relations of a given mode of production.
The standard of living is determined, on the one hand, by the degree of development of people's needs themselves, and, on the other hand, by the quantity and quality of life's goods and services used to satisfy them. It is directly connected with the reproduction of the main productive force of society - the labor force of workers. The standard of living clearly reflects the social differences between individual groups of the population. Therefore, the standard of living of various social groups and strata of the population, families and individuals can be considered.
The indicators characterizing the standard of living are diverse. The standard of living of the population of the Russian Federation is determined by the following main indicators:
- - volume of gross domestic product per capita;
- - the level of consumption of essential goods per capita;
- - inflation rate;
- - unemployment rate;
- - the value of real per capita income in relation to the minimum subsistence level;
- - the size of the actually paid average monthly wage of an employee in relation to the minimum subsistence level;
- - the share of citizens with incomes below the subsistence level in the total population of the Russian Federation;
- - the ratio of incomes of 10% of the most and least wealthy population;
- - the ratio of the average pension to the minimum subsistence level;
- - the average duration of the forthcoming and actual life of a person;
- - the ratio of births and deaths of the population;
- - the proportion of the population living in unsatisfactory housing conditions.
Indicators of the standard of living are classified according to individual criteria: general and particular; economic and socio-demographic; cost and natural; quantitative and qualitative, etc.
General indicators characterize the general achievements of the socio-economic development of society. These include the size per capita: gross domestic product, national income, consumption fund, consumer fund of national wealth. Private indicators are also determined by social development, but they are more detailed and specified for individual groups of needs. Among them are: the level and methods of consumption; housing and home improvement; working conditions; the level of socio-cultural services; conditions for raising children; social security, etc.
Economic indicators characterize the economic side of the life of society, the economic possibilities of meeting needs. These include indicators that characterize the level of economic development of society and the well-being of each person (nominal and real incomes, their differentiation, employment, etc.). Socio-demographic indicators characterize the sex and age, occupational and qualification composition of the population, and average life expectancy.
Cost indicators include all indicators of income and other indicators in monetary form (commodity turnover, volume of services, transportation, cash deposits and savings, etc.). Natural indicators characterize the volume of consumption of specific material goods and services in physical terms (kg, pieces, sq.m., cubic meters, etc.) - the consumption of food, energy, the provision of property, housing, cultural and household goods destination.
Quantitative indicators characterize the volume of consumption of specific goods and services. Qualitative indicators make it possible to characterize the qualitative side of the population's well-being: the level of education, qualifications, consumption patterns, provision with durable social and household items, etc.
It is the qualitative side of people's lives, which often cannot be quantified, that is becoming increasingly important for characterizing their well-being, the degree of satisfaction of not only material, but also social and spiritual needs. In this regard, in recent years, in world and domestic practice, along with the concept of the standard of living, the concept of quality of life is increasingly used.
The quality of life is a category that characterizes the essential circumstances of people's lives, which determine the completeness of satisfaction of the whole complex of their needs, the degree of dignity and freedom of the personality of each person (quality food, housing, environmental conditions, the level of culture of the population, the quality of education, the degree of mastery of scientific knowledge , working conditions, rest conditions, social conditions, etc.).
Currently, there is no rational method for bringing heterogeneous indicators of the standard of living to a single indicator that comprehensively characterizes the level and quality of life of the population. At the same time, attempts are known and there is experience in the development of such indicators by foreign and Russian scientists.
Since the second half of the 80s of the last century, in accordance with the United Nations Development Program, the human development index (HDI) has been used as an integral indicator in world practice. It (I RPP) is calculated as the arithmetic average of three indices: gross domestic product per capita (I GDP), life expectancy (I LS) and the level of education of the population (I OBR), correlated with the highest world levels of these indicators:
Each index is calculated using the formula:
where D f is the actual value of the indicator in this country for the period under study;
D min and D max - respectively, the minimum and maximum value of the indicator in the world. In this case, the level of education in each country (D OBR) is calculated as the weighted average of the share of literate population (d LE) aged 25 years and over (weight 2/3) and the share of students (d LE) among the population under 24 years of age (weight 1/3): D OBR \u003d d GR * 2/3 + d UCH * 1/3.
With all the advantages (simplicity of calculation, universality, statistical accessibility), the HDI does not fully cover the conditions of life and has a number of assumptions (for example, the equivalence of its three components). Therefore, the search for new methods of integral assessment of the level and quality of life of the population continues.
For example, experts from the All-Russian Center for Living Standards (VTSUZH) proposed a method for determining the index, which covers all components of the standard of living with their importance weighed by the urgency of the corresponding needs, depending on the elasticity of the costs of satisfying them in the household.
S.A. Ayvazyan proposed a methodology for assessing the quality of life of the population by groups of indicators characterizing the quality of the population, the well-being of the population, the quality of the social sphere, the quality of the ecological sphere, and natural and climatic conditions.
Commissioned by the British edition of The Economist, its experts conducted a study of the quality of life of the population of different countries based on a scoring of a variety of indicators, nine of which were identified as the main ones: GDP per capita; degree of satisfaction with the health system; unemployment rate; climatic conditions; observance of civil liberties; political stability and security; development of public life; comfort of family life; gender equality. All values (except for GDP per capita) were determined by asking citizens how satisfied they are with this or that indicator. The overall assessment was made on a 10-point scale. Obviously, such a technique does not give an objective assessment of the level of quality of life in a particular country, but characterizes the degree of satisfaction of the population with it.
One of the important elements of the quality of life is the quality of working life, which is understood as a systematized set of properties that characterize the conditions of people's industrial life and allow taking into account the degree of realization of the interests of workers and the use of their abilities (intellectual, creative, moral, organizational, etc.). The quality of working life is the main criterion for the development of social and labor relations.
The quality of working life is determined by a number of requirements:
- - the work should be interesting, meaningful, characterized by a high level of organization, include creative elements;
- - work should be socially useful, the employee should feel a harmonious connection with the social environment;
- - employees should receive fair remuneration for their work and recognition of their work;
- - work must be carried out in safe and healthy working conditions;
- - employees should be provided with the opportunity to use the social infrastructure of the organization;
- - employees should participate in making production decisions affecting their work and interests;
- - Employees must be guaranteed employment, legal security, the possibility of professional growth and the development of friendly relations with colleagues.
The quality of working life is a multifaceted concept and cannot be assessed by any single indicator. Most often, it is characterized by a certain set of economic and social indicators that reflect the conditions of the production life of workers. At the same time, the assessment of the quality of working life can be carried out from the positions of the employee, entrepreneur and society as a whole (see Table 1).
Table 1. Indicators of the quality of working life
|
Assessment levels |
||
|
From an employee's point of view |
From an entrepreneur's point of view |
From the point of view of society as a whole |
|
|
|
The central place in the studies of the quality of life is given to the development of a methodology for assessing the quality of life, which explains the solution of such issues as the construction of indicators of the quality of life, the determination of the values of these indicators, the choice of methods for their assessment, resulting in a generalized judgment about the standard of living of an individual, a group of people, a particular region. or the country as a whole. Studies give reason to believe that the economic category "quality of life of the population" can be defined as "formed in the mass consciousness, a generalized assessment of the totality of characteristics of the living conditions of the population."
These characteristics can be considered using seven integral properties of the quality of life:
1. The quality of the population, integrating such properties of it as the ability to reproduce (fertility, mortality, morbidity, disability, life expectancy, etc.), the ability to form and maintain families (marriage, divorce), the level of education and qualifications (share of the population covered by training in the respective age groups, the achieved level of education, etc.).
2. Welfare. The material aspect of well-being is characterized by indicators of income, current consumption and savings of the population (the amount of income in real terms, their distribution by areas of use and various socio-economic groups of the population, the structure of consumer spending of the population, the presence of consumer durables in households, the accumulation of property and valuables etc.), as well as macroeconomic indicators such as GDP per capita, actual household consumption, consumer price index, unemployment and poverty rates.
3. Living conditions of the population. The concept of "living conditions" includes the characteristics of housing conditions, the provision of the population with the capacities of health care, education, culture, use of free time, social and geographical mobility, etc.
4. Awareness of the population, characterizing the accessibility to telecommunications and information infrastructures (mobile radio operators, information resources, Internet technologies, etc.).
5. Social security (or the quality of the social sphere), reflecting working conditions, social security and social protection, physical and property security.
6. The quality of the environment (or the quality of the ecological niche), accumulating data on air pollution, water pollution, soil quality, the level of biological diversity of the territory, etc.
7. Natural and climatic conditions, characterized by climatic conditions, frequency and specifics of force majeure situations (floods, earthquakes, hurricanes and other natural disasters).
Let's talk about indicators.
Quality of life indicators are objective and subjective.
Objective indicators: natural and social. They reflect such values as per capita income, population migration, mortality rate, or phenomena such as crime, alcoholism, divorce, suicide, and so on. Objective indicators are also relative, when the consumer's financial situation is no longer determined by the absolute amount of his income, but by his relative position on the income scale, his position in society. A person may benefit from an increase in the absolute level of his income, but if the income of others increases in that proportion, then he will ultimately consider his position unchanged on the income-expenditure scale. The concepts of "necessary goods" and "luxury goods" become highly interchangeable over time, both when comparing countries with different levels of development, and when comparing different stages of development of the same country.
Subjective measures reflect the perceptions that are present in various surveys or public opinion polls.
There are a number of signs by which indicators of quality of life can be grouped:
1. Depending on the hierarchical level. They are called macro indicators. They characterize the satisfaction of needs at the level of the individual or family. These include GDP, GNP; nominal or real incomes of the population; demographic indicators; duration of the working week; free time; inflation rate, etc.
2. Depending on the nature of the reflection of the essence of the category - the standard of living. They are direct and indirect. Straight lines directly characterize the standard of living itself. For example, the level of food consumption.
indirect indicators. Indirectly characterize the standard of living. These indicators include demographic indicators.
3. Depending on the nature of the calculation. These include level indicators that show absolute values; structural, they are components of level indicators, as well as dynamic. They characterize the change in absolute indicators.
4. Depending on the group of needs, the satisfaction of which characterizes one or another indicator. There are three main groups of needs: physical, spiritual (or they are also called intellectual) and social.
One of the most important indicators of the quality of life is the HDI (Human Development Index). It is calculated annually and shows the standard of living, literacy and education of the population. It serves to compare the level and quality of life in different countries.
When calculating the HDI, 3 types of indicators are taken into account:
· Life expectancy -- evaluates longevity.
· The level of literacy of the population of the country (average number of years spent on education) and the expected duration of education.
· Standard of living measured in terms of GNI per capita at purchasing power parity (PPP) in US dollars.
According to 2013 data, the HDI index of Kazakhstan is 0.8 and Kazakhstan ranks 69th in the list of countries with a very high development index.
UN Members HDI World Map 2013. [Apps Map 1]
Also, to assess the satisfaction of various needs, various groups of indicators and their indicators are used [Appendices, table. one]
There are also various systems of indicators of quality of life. All of them are different, as they cover only certain groups of indicators.
One of the very first, effective and famous scorecards is a system developed in the USA. This system is called the "Social Indicators" system. It consists of 7 blocks (health, public safety, education, work, income, housing, leisure). These blocks include 167 indicators. For example, in the "labor" block there are such indicators as job satisfaction, quality of working life, and others. This system effectively reflects the quality of life in various spheres of life.
Also one of the well-known systems is the system developed by the UN European Commission. In this system, 8 groups were identified: health, quality of the workplace, quality of the physical environment, a sense of social confidence, etc.
Thus, we see that there are different groups and systems of indicators of the quality of life. In general, it is rather difficult to collect all the indicators and standardize them all into one system. After all, the very concept of quality of life is very broad. It is possible, for example, to create a system of economic indicators of the quality of life, which will give us the opportunity to assess the quality of life from an economic point of view. And you can create a system of social indicators.
The structure of the indicators themselves is also varied - from several generalized ones, which cover only essential aspects of life, to multi-level systems, including detailed enumerations of various factors and components. All of them in their own way reflect the goals of classifications, and approaches to understanding the problem of quality of life.
Quality of life standards
A standard is a document developed by consensus and approved by a recognized body that establishes for general and repeated use rules, general principles or characteristics relating to various activities and their results.
Standards invariably affect the management of human quality of life.
High standards of quality of life are perceived as the only possible and justified around the world.
Kharitonova Tatyana Viktorovna, Workshops Inna Pavlovna"Economics and Entrepreneurship" FGOUVPO "Russian State University of Tourism and Service"
The structure and content of the concept of "quality of life"
In modern conditions, improving the quality of life of the population is an element of the socio-economic policy of the state, and measures to implement this policy are often of a program nature.
Let us dwell in more detail on the content of the concept of "quality of life". It should immediately be noted that in a number of studies and programs the concept of "quality of life" is artificially narrowed and replaced by the concept of "standard of living". This approach seems wrong to us, because the standard of living is primarily a socio-economic category focused on a quantitative assessment of the degree to which certain needs of people are met (for example, in food, clothing, housing, medicines, personal services, etc.). ). Determining the standard of living is related to the amount of funds directed by people to meet their needs, the level and structure of personal consumption. Therefore, this category is limited to estimates of its constituent indicators in monetary or physical units. The UN documents note that the standard of living is calculated as the level of satisfaction of the needs of the population, provided by the mass of goods and services used per unit of time. Therefore, in order to determine the standard of living, it is necessary first of all to determine the degree of satisfaction of the needs of the population.
The concept of "quality of life" in contrast to the "standard of living" reflects the degree of satisfaction of the whole complex of human vital needs. Therefore, the quality of life is considered as a system of quantitative and qualitative indicators characterizing the degree of implementation of people's life strategies, satisfaction of their life needs. It is extremely difficult to give a direct quantitative assessment of the quality of life of the population, since it integrates many aspects of the standard of living of people. In particular, individual needs that are not fixed by any statistical values and practically exist only in the minds of people, in the form of their personal opinions and assessments.
Currently, there is no generally accepted scientific definition of the concept of "quality of life", therefore, each author, as a rule, focuses on one of the aspects of this concept.
A number of definitions of the quality of life refer to the degree of satisfaction of the material, cultural and spiritual needs of a person. In others, more complete and specific, a direct comparison is made between the actual level of satisfaction of needs with the baseline. All comparison procedures can be divided into two main groups:
- based on subjective self-assessment;
- based on an external objective assessment.
Consider definitions of quality of life based on subjective self-assessment.
Quality of life is people's perception of their position in life in relation to cultural characteristics and value systems and in relation to their goals, expectations, standards and concerns. Obviously, this definition is based on the level of satisfaction with one's life. And this level is largely determined by the expectations of each individual and depends on the standards adopted in the social microenvironment with which he associates himself.
As an example of the definition of the quality of life based on an external objective assessment, we present the definition given by the specialists of the National Institute of Health P.P. Gorbenko and V.V. Spoon. The quality of life is understood as a theoretical system consisting of the objective conditions of existence and their assessment at the level of society and the individual. In accordance with this definition, the quality of life is assessed not by subjective satisfaction by the person himself, but by a number of objective indicators by other people who have complete and reliable information and the necessary qualifications for this, i.e., by a team of experts. The following can be considered as objective indicators of the quality of life:
- clean environment,
- personal and national security,
- political and economic freedoms,
- ensuring the right to work, the possibility of career growth and raising the professional and intellectual level,
- ensuring the demographic growth of society,
- creation of living conditions,
- providing health care and improving the system of medical care for the population,
- providing food to the population.
All of the above indicators should be considered in accordance with international standards and norms established by the UN.
The components of the quality of life represent a complex classification system for various indicators. This allows us to analyze the quality of life of the population according to the following constituent criteria:
- population quality,
- welfare of the population,
- the quality of the social sphere,
- ecological niche quality,
- natural and climatic conditions.
It is possible to single out more detailed elements of the criteria for the quality of life of the population:
- environmental component;
- life safety;
- political and economic freedoms;
- working life and career opportunities;
- the sphere of developing people's abilities and raising the professional and intellectual level;
- family life and ensuring the demographic growth of society, solving housing problems, forming a culture of healthy housing;
- improving the level of health and longevity of the population, improving the system of existing medical care for the population, expanding the list of free care, ensuring its effectiveness and quality, increasing the availability and mass character of sanatorium-resort and health services to the population;
- providing food to the population in accordance with international standards and regulations established by the UN;
- implementation of the strategy of safe personal development. A more detailed description of the individual elements of the quality of life can be given using a system of indicators, such as the subsistence minimum, the consumer basket, the population's income, and the minimum wage. All of the above indicators are currently used in the system of strategic planning for the development of the national economy.
There are also specific indicators of quality of life. For example, when characterizing the quality of nutrition, one should not be limited to its assessment only by nutritional value (calorie content, content in grams of proteins, fats). It is impossible to bypass such characteristics as the regularity of nutrition, its diversity, taste properties. Describing the quality of working life, one cannot limit oneself only to the indicators of employment, unemployment, the length of the working day, week, year, and the level of industrial injuries. It is necessary to assess the compliance with the interests of workers of the content and nature of labor, its intensity, relationships within the workforce, etc.
Thus, the quality of life is the degree of development and completeness of satisfaction of the whole complex of needs and interests of people, manifested both in various types of activities and in the very sense of life.
The change in the quality of life of the population of Russia has always been accompanied by a differentiation in the socio-economic status of various groups of the population. Today, Russian society is divided into social strata, each of which has its own economic interests, a model of behavior. A layer of people has formed that has a significant impact on many issues of public life, including the social programs of the government, and inequality in the distribution of income and benefits has increased. That is why it is necessary to understand and form the quality of life as a system of objective conditions for the existence, activity and development of a person and society, assessed by the degree of compliance of these conditions, the results of a person’s activity and development with the norms, standards and values accepted in society.
Determining the structure and content of the quality of life category is important for assessing its level.
Study of the dynamics of indicators of the quality of life of the population in the Russian Federation for the period 2002-2008
To study the quality of life, we will use the indicators most commonly used in international and national assessments. For convenience, they are grouped into the following blocks.
Block 1. Socio-demographic indicators.
Block 2. Socio-economic indicators.
Block 3. Health system indicators.
Block 4. Socio-cultural indicators.
Block 5. Indicators of social and personal security.
Block 6. Social indicators.
Block 7. Social and environmental indicators.
Let's consider them in more detail.
The socio-demographic situation in the country largely reflects the quality of life of the population. One of the most important socio-demographic indicators is the population.
As you can see, since 1990 the population of the Russian Federation has been constantly decreasing (Fig. 1). During the period from 2002 to 2008, it decreased by 3,157,900 people, or 2.18%. The reasons for this are seen, first of all, in the excess of deaths over births, etc.
An analysis of the average life expectancy is essential for studying the indicators of the quality of life of the population. During the period 2006-2007, the life expectancy of the population increased, which is a positive phenomenon (Table 1). It should be noted that the positive trend of increasing life expectancy continues at the present time.
Table 1. Lifespan, number of years

Of undoubted interest is the dynamics of fertility and mortality in Russia.
The data indicate that the process of depopulation of the population is observed in the country, characterized by an excess of mortality over births. However, since 2005, the birth rate has steadily increased (Fig. 2). It is also worth noting that since 2005, mortality in the country has a steady downward trend. Unfortunately, Russia's population continues to decline to this day. Based on the presented data, it can be concluded that the value of this indicator is constantly decreasing.

Rice. 2. General birth and death rates (births and deaths per 1,000 population)
The institution of the family is in a difficult situation in the country (Fig. 3), although in recent years there have been some positive trends, which primarily include an increase in the number of marriages.

Rice. 3. Marriages and divorces, thous.
A slight decrease in the number of divorces somewhat improves the situation, but in 2007 this figure increases again. As you can see, the number of marriages exceeds the number of divorces.
Thus, the considered demographic indicators of the quality of life of the population allow us to speak about the insufficiently favorable socio-demographic situation that has developed in the Russian Federation, but, nevertheless, positive trends in recent years should be noted for a number of indicators.
In the course of the study, various statistical data were considered that characterize the socio-economic indicators of the development of the Russian Federation (Table 2).
Table 2. Main indicators of socio-economic development of the Russian Federation

It should be noted that at present the country is experiencing a gradual revival of the economic sphere, stabilization of the socio-economic situation, gradual alignment of the main socio-economic indicators of the standard of living of the population, as evidenced by the above statistical data.
One of the generalizing economic indicators of the quality of life of the population is the volume of the gross national product per capita. As you can see, the volume of GDP is constantly increasing. For the period under review, this indicator
increased almost 3 times. At the same time, it should be noted that GDP growth leads to an increase in the income of the country's consolidated budget. Also, over the past few years, there has been an increase in the expenditures of the consolidated budget. Since 2002, expenditures have increased by an average of 25%. Thus, the budget surplus in 2007 is 6% of GDP.
The socio-economic development of the country over the past few years has been characterized by an increase in real money incomes of the population (Table 3).
Table 3 Incomes of the population and socio-economic differentiation
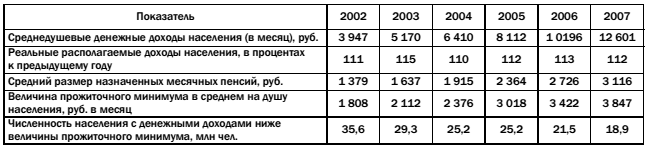
During the period under review, there has been a steady increase in disposable cash income. As you can see, the real incomes of the population are increasing every year, but the growth rate of this indicator remains practically unchanged. The dynamics of the subsistence minimum clearly illustrates the socio-economic situation. At the same time, positive trends are observed in the change in the number of people with monetary incomes, the value of which is lower than the subsistence minimum. Since 2002, this indicator has decreased by 16.7 million people.
An important indicator characterizing the quality of life of the country's population is the Gini coefficient, which reflects the degree of deviation of the line of the actual distribution of the total income of the population from the line of their uniform distribution. The value of the Gini coefficient can vary from 0 to 1, and the higher the value of the indicator, the more unevenly distributed incomes in society (Table 4).
Table 4 Distribution of total money income by 20% population groups

The presented data indicate an increase in the concentration of income among the most affluent groups of the population. The indicators under consideration should be supplemented with an analysis of the dynamics of the distribution of the population in terms of average per capita income (Table 5).
Table 5 Population distribution by average per capita monetary income, %

As can be noted, in the period 2004-2007, the country experienced an increase in the number of people with incomes above 10,000 rubles and a decrease in the number of citizens with incomes from 2,000 to 6,000 rubles. The most significant increase was in the population with incomes of 15,000 rubles or more. In this regard, we can talk about the presence of certain positive trends in the socio-economic sphere.
One of the important components of the quality of life of the population are indicators of the sphere of labor and employment of the population. Statistical data indicate that the number of economically active population, employed and unemployed citizens has changed with positive trends in recent years (Fig. 4).

Rice. 4. Number of economically active population, thousand people
As you can see, in the period 2002-2007, the number of citizens employed in the economy changed dynamically and as a result increased by 4,548 thousand people, or 6.8%. The number of unemployed citizens during the study period decreased by 1,909 thousand people, or by 31%. At the same time, the economically active population is growing in the country. Thus, over 5 years it has increased by 2,639 thousand people, or by 3.6%. Thus, we can say that along with an increase in the economically active population, there is a decrease in the number of unemployed citizens, which has a positive effect on the socio-economic situation in the Russian Federation, and, consequently, on the quality of life of the country's population.
An analysis of the work of the state employment service allows us to draw conclusions about the low efficiency of solving the problems of employment of unemployed citizens in the country (Fig. 5).

Rice. five. Employment of citizens by state institutions of the employment service, thousand people
Thus, in the period 2002-2007, 37,187 thousand people turned to the employment service, of which 24,033 thousand people were employed. Thus, the employment services placed on average about 35% of those who applied to them. The way out of a difficult situation can be the development of cooperation with organizations and institutions that have vacancies, the use of new employment technologies, the stimulation of the creation of additional jobs, the promotion of various forms of self-employment, the strengthening of career guidance for young people, etc.
Thus, in Russia in 2002-2007, certain positive changes were observed in the economic sphere: an increase in GDP, an increase in real incomes of the population, a decrease in the unemployment rate, etc.
The study of the health care system involves the study of morbidity rates of the population for the main classes of diseases (Table 6).
Table 6 Morbidity of the population by main classes of diseases (registered patients with a diagnosis established for the first time in their lives)

An important indicator of trouble in the field of public health is the number of HIV-infected people. Thus, at the end of 2007, 12,700 cases of the disease were registered in the Russian Federation, which is 32.3% more than in 2006.
The state of development of the healthcare system is also of great importance for assessing the quality of life of the population in the country. Let us dwell on the study of the dynamics of the number of individual health care institutions and medical personnel for the period under review (Table 7).
Table 7 Medical institutions and medical personnel, at the end of the year
The presented data indicate a decrease in the number of hospitals by 34%, and outpatient clinics by 14.5%. At the same time, there is an increase in the capacity of medical outpatient clinics by 3% in the country: in 2002, visits to patients per shift amounted to 247.8 people. per 10 thousand population, in 2007 this figure increased to 258.7. During the period 2002-2007, the number of hospital beds decreased by 4.2%. According to experts, with a heavy workload of hospitals, this is an unacceptable indicator. The number of medical personnel for the period under review increases by 3.6% or 24,900 people.
Thus, the data obtained indicate a rather complex situation related to public health in the Russian Federation.
The block "Socio-cultural indicators" includes indicators characterizing the sphere of education and culture of the country. In the course of the study, a quantitative analysis of individual indicators of the education sector was carried out. Of undoubted interest is the consideration of the dynamics of the number of preschool educational institutions (PEI) (Table 8).
Table 8 Performance indicators of preschool educational institutions
As you can see, there is an annual decrease in the number of preschool educational institutions in the country (by 6.5% over 5 years). There is also a constant increase in the number of pupils of preschool educational institutions, while there are only 565 places per 1,000 children. Thus, we can state a decrease in the number of preschool institutions with an increase in the number of children in the country.
Let us consider the dynamics of the number of other educational institutions (Fig. 6).

Rice. 6. Number of state and municipal educational institutions at the beginning of the academic year, thousand units
During the period 2002-2007, the number of schools and other educational institutions in the country has been constantly decreasing (by 14.2% over 5 years). The number of primary vocational education institutions, as well as secondary specialized educational institutions, has also decreased over the past few years (by 10.9% over 5 years). At the same time, during the period under review, there was an increase in the number of higher educational institutions in general by 6.6%. At the same time, the number of state universities remained almost unchanged; in 5 years, only 3 new universities appeared in the country. The increase in non-state higher educational institutions was 17.2%. This circumstance influenced the increase in the number of students in higher education (Fig. 7). The share of students of non-state higher educational institutions in the total number of students in 2007 is 16.8%.

Rice. 7. Number of students in institutions of general and vocational education (at the beginning of the academic year, thousand people)
Also in the course of the study, an analysis was made of the number of students in general educational institutions. As you can see, in recent years in general education institutions, as well as institutions of primary and secondary vocational education, there has been a constant decrease in the number of students. The total number decreased by 60.5%. The number of students in higher educational institutions, on the contrary, is growing every year.
In general, over 5 years, the growth amounted to 25.4%.
During the study of socio-cultural indicators, an analysis of statistical data on cultural institutions was carried out. The dynamics of the number of different cultural institutions is presented in Table 9.

Table 9 Cultural institutions, at the end of the year
As you can see, there is a gradual increase in such cultural institutions as theaters (by 4%), museums (by 12.7%), circuses (by 6.2%). Unfortunately, during the period under review, the number of libraries decreased by 6.9% and institutions of cultural and leisure type by 8.7%. Of interest is the analysis of the number of spectators and visitors to cultural institutions. Thus, the number of visits to theaters by the population decreased in 2004 to 196 people per thousand people of the population (in 2002 it was 207 people), but by 2007 the number of theater visitors increased, reaching 206 visits per 1,000 people of the population. A positive trend in the development of culture in Russia is an increase in such an indicator as museum attendance. During the period under review, it grew by 7.3%.
Of no small importance for characterizing objective indicators of the quality of life of the population of the Russian Federation is the analysis of indicators of social and personal security, which involves the study of data from the social security system of the population, as well as indicators characterizing offenses committed in the country.
An important area of activity of the system of social protection of the population in the Russian Federation is a large-scale, systematic work to improve the functioning and expand the network of institutions of social services for the population of the Russian Federation. The number of nursing homes for the elderly and disabled is changing (Table 10).
Table 10 Stationary institutions of social service for the elderly and disabled

It should be noted that there is a steady increase in the total number of nursing homes for the elderly and disabled (by 27%). In connection with this circumstance, the number of residents in stationary institutions is increasing annually in the country. It can be seen that in the period 2002-2007 it increased by 9.6%.
Of no small importance when considering indicators of social protection is the study of the number of institutions serving children. Until 2006, the indicator increased annually, but by 2007, the number of boarding schools for disabled children decreased by 7 institutions, which led to a reduction in the number of children living in these institutions.
Also, during the period under review, the number of those in the queue for placement in stationary institutions increased by 31.4%.
The number of social institutions of the country also includes centers of social services for the population. On the territory of the Russian Federation there are about 2,266 such centers and departments of social assistance at home. Since 2003, their number has increased by 16%. Pensioners and the disabled are provided with material, medical, social and household assistance, consulting services of psychologists, lawyers, and pension specialists. Also, in recent years, the costs of implementing social support measures for certain categories of citizens have been increasing (Fig. 8).

Rice. 8. Expenses for the implementation of social support measures for certain categories of citizens for the obligations of the constituent entities of the Russian Federation, million rubles
During the period under review, spending on social support in the country increased by 26.1% as a whole.
As you can see, the system of social security of the population in the Russian Federation is actively developing. At the same time, the priority areas for further development are: improving the quality management of social services based on state standards and regulation; timely identification of citizens who find themselves in a difficult life situation; introduction of a comprehensive rehabilitation of families and children, improving their quality of life, providing resources and improving the existing system of social services, etc.
Consideration of social and personal security involves the analysis of data characterizing the offenses committed in the country over the past few years (Table 11).
Table 11 Number of registered crimes, thousand

The dynamics of data on the number of various offenses in the country was studied. Thus, there is an increase in the total number of registered offenses by 41.8% over the period 2002-2007, which indicates a deterioration in the criminogenic situation in the country. The increase in the number of robberies was 76.4%, the number of registered thefts in the country increased by 69.1%, and cases of fraud more than tripled during the period under review (an increase of 204%). It should be noted that the number of violations related to drug trafficking is growing every year. The maximum value of the number of offenses was noted in 2006, when the number of crimes increased sharply in almost all respects. But still in the last two years there has been a decrease in the number of offenses by 7%. There is also a downward trend in such articles as murder and attempted murder (by 31.3%), intentional infliction of harm to health (by 19.1%), rape (by 13.6%), as well as violations of 70,000 traffic rules. movement (by 55%).
Thus, the analysis of individual indicators characterizing the criminogenic situation in the country allows us to note an increase in the number of such crimes as robberies, robberies, and fraud. Unfortunately, it should be noted that a significant number of crimes registered on the territory of the Russian Federation are committed by minors or with their complicity.
As part of the social indicators of the quality of life, the analysis of indicators characterizing the housing stock is of particular importance (Fig. 9).

Rice. nine. Housing stock and its distribution by type of ownership, mln sq. m (total area of residential premises; at the end of the year)
Available data suggest a significant increase in the housing stock. Over 5 years, the increase in the total area of the housing stock amounted to 7.3%. Moreover, the volume of housing stock owned by citizens is increasing annually, while the volume of housing stock owned by the state and municipalities is gradually decreasing.
The dynamics of the area of the housing stock per inhabitant on average increases over the period under review (Fig. 10). The provision of one inhabitant of Russia with a total area of housing increased by 8.6% (from 19.8 m 2 in 2002 to 21.5 m 2 in 2007), in urban areas by 9.2%, and in rural areas by 7.7% . This is an objective indicator of the increase in the housing stock in the country.

Rice. 10. The total area of residential premises per inhabitant on average (at the end of the year; sq. m)
In the course of the study, an analysis was made of individual indicators characterizing the state of the public utilities (Table 12).
Table 12 Improvement of the housing stock (at the end of the year; %)

Consideration of the improvement of the housing stock allows us to talk about the positive dynamics of this indicator. Thus, there is an improvement in such criteria as the availability of water supply, sewerage, heating, provision of hot water. The provision of gas and floor electric stoves for the period under review practically did not change and remained at the same level. The provision of all the listed communications in the complex increased by 17.3%.
An analysis of indicators characterizing the state and development of public transport in the country was also carried out. An important aspect of the study was the consideration of data on passenger transportation by individual types of public transport (Table 13).
Table 13 Passenger transportation by types of public transport, million people

As the data show, the volume of passenger traffic by public transport tends to decrease. For the period 2001-2006, it decreased by 45.5%. The main decrease in passenger traffic is observed in the category of intracity traffic: over five years, the use of bus transport has decreased by 42%; taxi - by 33; tram - 62; trolleybus - by 64; by metro - by 16; by inland water transport - by 27%. This is primarily due to the increase in the number of personal vehicles among the population. At the same time, in the period under review, an increase in passenger transportation by sea and air was noted - by 100 and 68%, respectively. This can be explained by the increase in the consumption of tourism services. The volume of passenger transportation by rail remained almost at the same level (an increase of 0.7%).
In general, the analysis of social indicators in the country revealed a number of positive changes, including an increase in the housing stock, improvement in the provision of housing for the population, improvement of housing, an increase in air and sea transportation, as well as an annual increase in the number of car owners in the country. All this makes it possible to judge the growth of the well-being of the population.
An important role in assessing the quality of life of the population of the Russian Federation is played by the consideration of social and environmental indicators that characterize the impact of economic activity on the state of the environment (Table 14).
Table 14 Key indicators characterizing the impact of economic activities on the environment and natural resources Indicators 2002

Analysis of the presented data allows us to note positive trends. Thus, during the period under review, water intake from natural water bodies decreased by 3.6%, the discharge of polluted wastewater decreased to 17.2 billion m 3 (by 13.1%), special vehicles removed 31.8% more household waste and twice as much household waste from industrial enterprises. At the same time, there is an increase in the amount of pollutant emissions both from stationary sources (by 5.6%) and from vehicles (by 12.5%). The situation with the removal of liquid waste is also seen as negative, since this figure is decreasing every year, and in 2007, 26% less was exported than in 2002.
A closer look at the problem of emissions of air pollutants allows us to note that a significant part of the emissions are substances such as sulfur dioxide, carbon monoxide and nitrogen oxide. The smallest amount in total emissions is noted for such substances as volatile organic compounds and hydrocarbons. It should be noted that during the period under review there is a decrease in emissions of sulfur dioxide and carbon monoxide; nitric oxide emissions remain at the same level.
To study the environmental situation in the country, it is important to consider indicators that characterize measures to reduce the negative impact of human economic activity on the state of the environment (Fig. 11).

Rice. eleven. Commissioning of facilities for the protection of water resources and atmospheric air from pollution
Analysis of the data shows that every year the commissioning of capacities for the protection of water resources from pollution is increasing. It should also be noted that the capacity for the protection of atmospheric air, that is, installations for capturing and neutralizing harmful substances from exhaust gases, tends to decrease.
In conclusion, it should be said that the analysis of indicators characterizing the level of organization of the living space of the population of the Russian Federation, carried out in the course of the study, as a whole, made it possible to identify the presence of positive dynamics in the quality of life of the population, which is a consequence of the revival of economic activity and the stabilization of the social situation in the country.
Existing approaches to assessing the quality of life of the population in Russia
In the characteristics of the quality of life proposed by various authors, in one form or another, the level, conditions and quality of life of the population are taken into account.
One of the approaches to assessing the quality of life of the population is the use of the Human Development Index (HDI). It is calculated on the basis of three indicators:
- longevity, measured as the average life expectancy at birth;
- the level of education achieved, measured as a combination of the adult literacy index and the total enrollment rate index;
- standard of living measured in terms of real GDP per capita in US dollars at purchasing power parity.
Calculations show that the HDI in Russia in 2008 was 0.806. In accordance with this index, Russia occupies 73rd place, which is a rather high indicator, but at the same time it is inferior to Belarus and Kazakhstan.
The index began to fall with the beginning of the 90s due to the decline in GDP and the increase in the death rate. In 1992, Russia ranked 52nd, in 1995 - 114th, in 2004 - 57th, in 2005 - 62nd, in 2006 - 65th, in 2007 - 67th place. In general, modern Russia is characterized by a very low life expectancy and a decline in the level of education.
HDI data are available for all countries in the world, but Table 15 shows the countries with the highest and lowest values of the indicator.
Table 15 Countries with the highest and lowest HDI values

The 2008 report shows that the HDI is growing in all countries of the world, with the exception of some countries of the post-Soviet space and Africa.
The HDI also varies greatly across regions of Russia. According to the Independent Institute for Social Policy, in 2008 the highest HDI value among Russian regions was in the city of Moscow - 0.907 (which is comparable with countries such as Germany, Italy, etc.), the lowest index in the Republic of Tuva - 0.691 (comparable with Tajikistan, Kyrgyzstan and etc.). Most of the Russian regions belong to the category with an index value of 0.750 - 0.799, which is quite comparable with such countries as Kazakhstan, Ukraine, etc.
Due to the fact that in Russia there is no system of regular and representative for all regions surveys of the quality of life necessary to obtain subjective assessments, the only possible approach to assessing the quality of life of the population is an objective (statistical) approach based on the use of regularly collected and available data. Within the framework of this approach, the study of the quality of life is carried out on the basis of an integral indicator - the index of quality of life.
The quality of life index presented below was calculated by employees of the Faculty of Geography of Moscow State University by order of the Ministry of Economic Development and Trade of the Russian Federation. The index is intended for an integral assessment of the priority components of the quality of life in the constituent entities of the Russian Federation and for monitoring the social development of regions. Priorities in assessing the quality of life were chosen taking into account the most acute problems of the transition period. If in Soviet times the differences were largely determined by living conditions (accessibility and provision of basic services, favorable living conditions in the region), then in modern conditions the problems associated with the level of income and its differentiation, employment, health of the population (especially children ), etc. These components are included in the "crisis" index of quality of life, developed for the integral assessment of regional differences in the most problematic aspects of the quality of life. With the help of such an index, it is possible to monitor and express-diagnose the social situation in the regions.
To determine the quality of life index, statistical data for 2007 were collected and analyzed for the seven largest Russian cities - the capitals of the federal districts of the Russian Federation (Moscow, St. Petersburg, Nizhny Novgorod, Rostov-on-Don, Yekaterinburg, Novosibirsk and Khabarovsk). Calculations of the "crisis" index confirm the significant differences between these regions (Fig. 12).

To the greatest extent, the index depends on the standard of living, so the most economically developed subjects of the Russian Federation - Moscow, St. Petersburg - prevail among the leaders. Next come a large metallurgical center - Yekaterinburg, then Nizhny Novgorod, in which the leading role belongs to enterprises in the engineering and metalworking industries. Fifth place is occupied by Rostov-on-Don, the largest manufacturer of modern agricultural machinery. Next comes Khabarovsk, the center of the Far East. Last but not least is Novosibirsk, the third most populated city in Russia, with dozens of research institutes located on its territory.
Let us conduct a more detailed analysis of the components of the quality of life.
The first of the constituent indicators is the ratio of per capita cash income to the subsistence minimum. The higher this figure, the better. 7 was chosen as the maximum value of the indicator. The indicator closest to this value is in Moscow, where the average per capita wage is 6.1 times higher than the subsistence level. Novosibirsk occupies the last position, since wages there exceed the subsistence minimum only twice.
The share of the population with incomes above the subsistence level in Moscow is 87.4% (100% was taken as the maximum value), and in Novosibirsk it is 81.8%, i.e., about 20% of the population is below the poverty line.
Moscow is the leader in terms of employment. Of the maximum 100%, 99.2% of the able-bodied population is employed in the capital. In this group, the lowest level of employment is observed in Rostov-on-Don, where only 93.2% of the population is involved in the economy.
Health indicators also affect the result. For example, Moscow and St. Petersburg have low infant mortality rates of 7 and 5 deaths per 1,000 population, respectively, and higher life expectancy of 72.5 and 70 years, respectively. The highest rate of infant mortality was noted in Rostov-on-Don, it is equal to 12.5 cases per 1,000 population, and the lowest life expectancy is in Khabarovsk, where the average life expectancy is 64.7 years.
The comparative analysis carried out made it possible to generalize the obtained results as follows. Moscow and St. Petersburg are cities of federal significance, which are the largest political, economic, financial, transport and cultural centers of the country. All this determines high places in the ranking. On the example of Yekaterinburg, one can see how the availability of raw material resources and the possibility of their export can positively influence regional development. In regions that do not have rich natural resources, but in which an active economic policy was carried out at the initial stage, aimed at developing production and attracting investments, the average value of the quality of life index was achieved. These are the cities of the Volga and Southern Federal Districts, as well as the Far East. Novosibirsk takes the last place in the ranking. There is no mining industry in this city, but it is a major scientific center not only in Russia, but throughout the world.
Thus, the results of the study made it possible to assess the impact of the economic and geographical position of the region on the level of regional development, as well as highlight the most significant factors affecting the quality of life indicators.
The results of a study of the quality of life of the population in the Central Federal District of the Russian Federation
As noted earlier, an equally important component of assessing the quality of life of the population is the subjective assessment by individuals of their income, employment, level of education, level of protection from crime, degree of confidence in the future, etc. In this regard, when assessing the quality of life, one cannot be limited only to objective indicators, studies are needed that reveal the subjective parameters of the quality of life.
To analyze the subjective indicators of the quality of life of the population, a sociological study was conducted to determine the components of the quality of life and, in accordance with the selected components, the degree of satisfaction of people with the quality of life. The basis of the study was a survey of respondents, which was conducted by the method of questioning. The volume of the general population was 165 people from various subjects of the Central Federal District (Moscow, Moscow Region, Kostroma Region, Tula Region, Lipetsk Region, etc.).
The social composition of those participating in the survey is as follows: 8% - the population is younger than working age; 80% - population of working age; 12% - population older than working age.
In the questionnaire, the questions were grouped into blocks: economic indicators, physical indicators, psychological indicators, socio-cultural indicators, indicators of social security.
The block "Economic indicators" contained questions characterizing the production and economic component of the life of the respondents.
Table 16 Assessment of material wealth

The results of data analysis show that a significant number of respondents assess their financial situation as average. The second place in popularity was taken by the option “secured, prosperous”. 9% of respondents live in poverty, and do not deny themselves anything, while having significant savings, 7.7%, which is a good indicator. 2.3% live very poorly, i.e. 3-4 people out of 165.
It was also revealed the attitude of respondents to the change in their financial situation in recent years. To the question “How did you live a year or two ago?”, the respondents spoke as follows: in the main - better - 43.1%; also, without significant changes - 30%; much better - 21.9%; worse - 5%. It can be noted that 65% of respondents note the presence of positive changes in their lives, only 5% - negative changes.
Taking into account the need to assess the respondents' opinions about the hopes for a prosperous life, they were asked the question "What are your assumptions regarding the change in your level of material prosperity in the near future?" The answers are as follows: yes, I hope to get rich in the near future - 37.3%; I doubt that it is possible - 21.4%; I do not hope - 17.8%; I am already rich and will be even richer - 13.6%; found it difficult to answer - 9.9%.
The block "Economic indicators" also included the study of questions related to the extent to which respondents are concerned about economic problems. So, to the question “Do you feel a threat to yourself and your family?” - respondents answered as follows (Table 17).
Table 17 Respondents' assessment of threats to themselves and their families

The results obtained allow us to say that the threat of housing shortages and other housing problems are of the greatest concern to the population (20.3% of respondents). Almost the same percentage of respondents put the problems of hunger and poverty, as well as the threat of dismissal from work, unemployment in second place. Next come the problems associated with health (14.4%), cataclysms and the environment (12.2%), a decrease in the quality of education in the country (11.2%). The political problems and threats of interethnic conflicts close the row (6.7%).
Table 18 Satisfaction assessment of respondents, %

According to the survey data, more than a third of the population showed a fairly high satisfaction with the situation in all of the above criteria, which is a good indicator.
As part of the survey in the "Physical indicators" block, the respondents were asked the question: "Assess satisfaction with your health on a five-point scale." The health outcomes are as follows: 15% of respondents feel great; good - 26.8%; satisfactory - 28.1%; 15.1% are dissatisfied with their health, and 9% have very poor health. As you can see, the majority of respondents (70%) note a fairly high degree of satisfaction with their health.
This block also included a question about the extent to which respondents are concerned about various problems related to health and medical care. So, when answering the question, the following results were obtained (Table 19).
Table 19 Threats related to health and medical care

Among the health-related threats, the respondents who took part in the study took the first place directly, the threat of health deterioration. In second place is the threat of deterioration in medical care. The threat of alcoholism, drug addiction and substance abuse worries the respondents least of all. This is due to the fact that, according to the respondents, these diseases are more of a socio-psychological nature and are under the control of a person.
To the question "Would you like to change certain aspects of your life?" the following responses were received (Table 20). The results suggest that a third of the respondents would like to change their place of work, and another third of the respondents wish to change their place of residence. 18.7% of respondents show a desire to change their profession.
Table 20 Desire to change certain aspects of your life

The third block allocated for the analysis of the opinions of the population regarding the quality of their life was the block "Psychological indicators". It included questions related to the assessment of the psychological subjectivity of the respondents.
Of interest are the data characterizing the general mood of the respondents. To the question “In what words could you define your mood lately?”, the respondents answered as follows: optimistic mood prevails in 6.3% of respondents; mostly optimistic - 16.7%; most of the respondents (52.7%) experience optimism and pessimism at the same time; tension and irritation - 6%; indifference, apathy and hopelessness - 5%; fear, pessimism and melancholy - 4%.
Table 21 Life satisfaction score

The results obtained show that 40.6% of the respondents are satisfied with their lives in general, and 48.7% rate their quality of life highly.
On the question “With what dominant feeling do you think about the future?” The respondents' answers were distributed as follows: I think with confidence - 23.3%; rather with confidence - 35.1%; rather with uncertainty - 22.9%; with anxiety - 17.3%.
As you can see, the main feelings that arise when thinking about the future is still confidence in the future. At the same time, feelings of anxiety arise in 17.3%.
In the course of the study, the respondents were asked questions aimed at studying the quality of life indicators included in the “Sociocultural indicators” block.
To assess the indicators of this block, the respondents were asked the question “Which of the problems in Russia is the most acute and requires urgent intervention, solutions?”
It is noteworthy that 32.7% of the respondents answered that this is a problem of the growing lack of spirituality, the moral decay of people. This answer is the second most popular answer after the answer “the problem of increasing crime, aggression and violence”, which was chosen by 44.1% of respondents. According to 7.7% of respondents, the problems of the Russian people, their culture, and sovereignty are currently acute problems that need to be addressed. Also, such answers as “underdevelopment of the legislative framework in Russia”, “problems of unemployment”, “weak organization of social protection”, etc. were noted (15.5% in total).
The block also included a question to determine how much the respondents are concerned about problems of a socio-cultural nature. So, to the question “Do you feel threats in socio-cultural terms for yourself and your family?” respondents answered as follows: they are concerned about the threat of a decrease in the level and quality of education, the lack of an opportunity to provide themselves and their children with a decent education - 11.2%; exacerbation of interethnic or interethnic conflicts - 4.1%.
Consideration of the block "Indicators of social protection" is due to the fact that the level of social protection in the country largely reflects the quality of life of its population.
When answering the question “What forms of social assistance do you need”, the respondents had to mark 2-3 most significant ones. The results are presented as follows: human rights assistance - 41%; informational - 23.4%; consulting - 21.9%. Home assistance was also named - 7.1%; assistance in vocational training - 3.6%; rehabilitation assistance - 3%.
It was interesting to consider the results obtained when answering the question "Who usually helps you solve life's problems?". In the first place is the family - 81.3%; friends - 10.6%; sponsors - 2%; distant relatives - 1.8%; social service workers - 1.8%. These data allow us to note that family and friends play a dominant role in solving the life problems of the respondents. Only a small percentage of the respondents involved medical and social workers in solving personal problems.
Thus, in the course of the study, it was revealed that the study of the subjective assessment of the quality of life of the population allows us to speak about the predominance of positive assessments. The survey data also confirmed the presence of positive changes in the quality of life of the population over the past few years. Thus, there is an improvement in the material situation of the population, which is expressed in an increase in real cash income; reduction in the number of poor people; an increase in the level of employment of the population with a constant decrease in the level of unemployment, etc. The development of higher educational institutions is observed; growing satisfaction of the population with the quality of education; expanding the accessibility of individual cultural institutions. In the field of social and personal security, there is a dynamic growth in the quality of social services, as well as a decrease in the growth of crime (in certain areas). In the social and domestic sphere, one can note an increase in the area of dwellings per inhabitant on average, a positive trend in the improvement of the housing stock and house territories.
However, along with positive changes in the quality of life of the population of the Russian Federation, a number of negative factors are noted. In the country's economy, an increase in the concentration of income in certain groups of wealthy citizens is planned, and problems of housing affordability for certain categories of citizens remain. In the field of public health, an increase in the incidence of almost all groups of diseases is observed.
The results of the research also allow us to conclude that in order to identify the dynamics of changes in the quality of life of the population of the Russian Federation, it is necessary to monitor the main indicators of the quality of life, which will increase the efficiency of choosing mechanisms for its provision and improvement. One of the effective tools for such monitoring can be a sociological analysis of the quality of life of the population. It allows you to identify a set of objective and subjective indicators that characterize the change in the vitality of the population, its living space, as well as evaluate the mechanisms for ensuring the quality of life in terms of their effectiveness.
This study was organized and conducted in 2009 with the direct participation of I.P. Workshops.
Population quality indicators.
| No. p / p | Indicator | Likely socio-economic impacts | |
| 1. | Total fertility rate (average number of children born to a woman of reproductive age) | 2,14 – 2,15 | No simple replacement of generations |
| 2. | Conditional depopulation coefficient (the ratio of the number of deaths to the number of births) | 1,0 – 1,3 | Intensive depopulation: death rate exceeds birth rate |
| 3. | Life expectancy at birth | 69 years old - men; 77 years old - women | Decreased vitality of the country's population |
| 4. | Infant mortality (number of children who died before the year, per 1000 births) | Reducing the number of children | |
| 5. | Maternal mortality (per 100,000 births) | Deteriorating health of newborns, orphanhood | |
| 6. | Number of mental pathologies (per 100,000 of the population of the corresponding age) | Growth of the indicator | Deteriorating health of the nation |
| 7. | Tuberculosis incidence in the population (per 100,000 of the population of the corresponding age) | 35.0 (epidemiological threshold) | Deteriorating health of the nation |
| 8. | Incidence of the population with venereal diseases (per 100,000 of the population of the corresponding age) | Growth of the indicator | Deteriorating health of the nation |
| 9. | Level of alcohol consumption per capita, liters | 8,0 | The degradation of the nation |
Table 2.
| No. p / p | Indicator | Ultimate critical value |
| 1. | Standards of living:- the number of people with incomes below the subsistence level in % of the total population | |
| - the ratio of cash incomes of 10% of the most and 10% of the least wealthy population, times | ||
| – social unemployment rate, % | ||
| - the ratio of the average wage to the living wage | 2,1 | |
| 2. | The quality of life:– health care spending as a % of GDP | |
| – spending on culture as a % of GDP | ||
| – provision with housing, sq.m. | ||
| – the number of crimes per 1000 population | ||
| – natural increase of population per 1000 inhabitants | 3-8 |
Maternal and child health continues to deteriorate in Russia; 20% of preschoolers and 50% of adolescents suffer from chronic diseases, only 15% of school graduates are practically healthy.
According to experts, over 70% of the country's population lives in a state of prolonged psycho-emotional and social stress, causing an increase in depression, neuroses, reactive psychoses, psychosomatic diseases, as well as alcoholism, drug addiction, and antisocial outbreaks. Over the past 10 years in Russia, the number of people sick mental illness, increased by 1.5 times. The greatest increase in the incidence is observed in children and adolescents: among them, over 10 years, the number of mentally ill patients has increased by 2.5 times, and those with oligophrenia - by 24%. According to the Institute of the Human Brain of the Russian Academy of Sciences, 15% of preschool children, 25% of adolescents, and up to 40% of conscripts have mental health problems. The incidence of drug addiction is growing intensively: in 1999 compared to 1990, it increased 14 times, almost 4 million people in Russia tried drugs, and 2.5 million people. consume them regularly. More than 2 million citizens are registered in special institutions for alcoholism; alcohol consumption per capita was 14-15 liters.
Trends and nature of the incidence of the population causes an active growth disability. As of January 1, 1999 the total number of disabled people was 9.8 million people, of which 600 thousand are children under 16 years of age. Since 1996, the growth of disabled people has reached 1 million people. in year.
A comprehensive indicator of the health and vital activity of the population is average life expectancy. In Russia, in comparison with developed countries, it is 10-15 years less for men and 6-8 years for women. At the same time, the dynamics of this indicator in developed countries is extremely positive, in contrast to our country (22, p. 71).
The shown unfavorable changes in the public health of the population are possible only with a significant decrease in the quality of life, the unsatisfactory state of the social sphere, basic medicine and the absence of an appropriate social policy.
The above indicators are also associated with such an important socio-demographic indicator as infant mortality rate(i.e. the number of deaths of children under 1 year old per 1000 births). The level of infant mortality in the Russian Federation significantly exceeds the level of industrialized countries, as well as the threshold values of indicators characterizing national security. Only the CIS countries “lag behind” Russia in this indicator. The infant mortality rate in our country in 1990 was 17.4; in 1999 - 16.9. In 1999, this figure varies significantly by regions of Russia: from 10.1 in the Samara region, 10.7 in St. Petersburg to 22.8 in the East Siberian region and over 30 in the republics of Ingushetia and Tyva.
It is necessary to touch upon another important indicator that reflects the state of public health and the quality of life of the population. This so-called maternal mortality rate, showing the frequency of death in women due to pregnancy, during childbirth and within 6 weeks after childbirth. In our country, it is at the level of developing countries and is 5-10 times higher than in Western European countries, and even higher than some CIS countries (for example, Belarus 2.3 times).
The next indicator characterizing the qualitative potential of the population is mortality rate. If at the turn of the 80-90s. The general mortality rate of the population in the Russian Federation was at the average European level (10.7 ‰), in 1999 it significantly exceeded the level of all developed European countries (14.7 ‰).
The most affected as a result of premature death in the 90s. group is the working-age population, which has led to an increase in the overall mortality rate. If in the elderly, mortality increased slightly (by 3-16%), then in the working age, the increase in mortality was 35-70% with a maximum in men in the range of 20-44 years, in women in 20-34 years. From 1990 to 1999 the number of deaths in working age men increased by 41.4%, women - by 43.3%. At the same time, the mortality rate of men of working age is 4 times higher than that of women, i.e. the supermortality of men in Russia has reached extraordinary proportions. In the 1990s, the age-specific mortality rates for men aged 20-44 were 4 times higher, those aged 45-64 - 3 times, those aged 15-19 and 65-69 - 2 times higher than the age-specific mortality rates for women.
In international comparisons of male mortality rates, the most informative and socially significant indicator is living up to 60 years as well as expected duration value life at birth. The difference in life expectancy between men and women across the country is now 12 years. Such a large gap exists only in the CIS countries (Moldova, Ukraine, Belarus, Kazakhstan). For the whole world, the average difference is 4 years, in developed countries - from 5 to 8 years. The life expectancy of Russian men has been declining in recent years and in 2000 amounted to. 58.9 years, in a number of subjects of the Russian Federation this figure does not exceed 55-56 years. Life expectancy is directly related to the level of socio-economic development of the country and region. This figure in the group of developed countries in 1997. was 74.5 years for men and 80.9 years for women, in the most backward countries - 50.8 and 52.6, respectively. Compared to developed countries, the life expectancy of men in Russia is 14-16 years lower, and that of women is 8-9 years lower. At the same time, the life expectancy of men in Russia is 8 years shorter than in China and 2.5 years less than in India.
It can be stated that as a result of the changes that have taken place, Russia is approaching the countries of the "third world" not only in terms of the level, but also in terms of the structure of mortality. By the end of the 20th century, the country had developed such a structure of mortality in which the contribution of diseases caused by social stress decreased (i.e., the mortality rate from cardiovascular diseases and oncological diseases decreased). However, the proportion of deaths from diseases caused by the spread of poverty and the degradation of the healthcare system has increased. Thus, mortality from infectious diseases (mainly due to tuberculosis), from diseases of the digestive system and from mental disorders (due to alcoholism) is growing at a high rate.
Another important indicator of population quality is education. The possibility of obtaining a quality education that meets the needs of the individual and society is one of the most important conditions for human existence. The transformations taking place in Russian society in the last decade have led to significant changes in the education system. Experts note an absolute increase in the number of pupils and students, which is partly explained by the demographic wave of the early 1980s. For 1992-1999 the number of students increased 1.5 times, the number of students in lyceums and gymnasiums increased almost 10 times. The positive trends include the growing demand for higher education in the Russian Federation - in 1999. per 10 thousand people The population accounted for 279 students, which is 1.6 times more than in 1992. In terms of the number of students (208 per 10,000 people), Russia is in the group of developed countries. However, at the same time, the share of persons receiving vocational training decreased: the output of persons receiving working specialties decreased by 38.3%, and the number of secondary specialized educational institutions - by 374 units.
Having described above a significant part of the indicators describing the quality of the population, it is now necessary to consider indicators that reflect level and quality of life of the population in Russia and abroad.
The quality of life of the population is a complex integral indicator that includes qualitative and quantitative indicators that characterize the degree of satisfaction of the material and spiritual needs of people:
* the standard of living of the population (average per capita income, wages, business income, pensions, benefits);
* the amount of goods consumed per capita (food, clothing and footwear, refrigerators, televisions, etc.);
* indicators of spiritual culture and ecology (level of education, culture, healthcare, ecology, social protection);
* indicator of the quality of working life of the working population.
The main indicators of the quality of life of the population include:
1) Financial and economic indicators(national wealth, income and expenditure of the population, prices and inflation). national wealth per capita, if calculated as the sum of capitalized value and surplus product, is one of the main comparative indicators. income level(i.e. standard of living) of the population includes a set of indicators that characterize per capita cash income from various sources, the cost and structure of the subsistence minimum, as well as the volume of gross domestic product and external debt per capita.
2) Medical and environmental indicators(health and medicine, nutrition of the population, physical culture and tourism, ecology and environment, family). They characterize the vital activity, ecology and health of the population. This group of indicators testifies to the “health of the nation” (through demographic indicators of life expectancy, fertility, mortality, morbidity), health care and physical education expenditures. Environmental indicators indicate the level of environmental pollution as a human habitat. The well-being of the family is assessed by indicators of marriage and divorce.
3) Indicators of material well-being(labor and employment, housing and communal services, transport and communications, trade and consumer services, scientific and technical progress and production). This group of indicators reflects the level of employment and the degree of satisfaction of the population's needs for goods, as well as the development of productive forces in the sectors of the economy focused on the production of consumer goods. They characterize the living conditions of the population in the form of housing per capita, the availability of durable goods, telephony and gasification.
4) Indicators of spiritual well-being(education, culture, social security, personal security and crime, politics and community activities). These indicators characterize the social life of society and the satisfaction of spiritual needs based on an assessment of the level of education, culture, science, social life, trust in the authorities, crime, and the state of the family.
On the standard of living of the population and his material well-being can be judged by the following indicators: by the size of the average per capita cash income, by the size of the average wage, by the minimum subsistence level, by the unemployment rate, etc.
According to the Ministry of Labor and the State Statistics Committee of the Russian Federation, the quality of life of the population of Russia in 2002 was characterized by the following indicators. So, living wage per capita in the country on average for the 2nd quarter of 2002 amounted to 1804 rubles, which is 19.7% more than in the 2nd quarter of 2001. The cost of a minimum set of food the average for Russia in the first half of 2002 was 986.7 rubles. Compared to the beginning of the year, its value increased by 10.7%.
During the first half of 2002 growth consumer prices and tariffs for goods and services to the population(those. inflation rate) amounted to 9.8%.
Average per capita cash income population in the first half of 2002. amounted to 3269 rubles, which is 31.7% more than the average for the 1st half of 2001. Real disposable money income in the 1st half of 2002 they amounted to 107.9% compared to the 1st half of 2001, and in November 2002 compared to the same period of the previous year they increased by 7.7%.
Accrued average monthly salary worker in June 2002. amounted to 4522 rubles and increased by 37.8% compared to June 2001, and in November of this year it amounted to 4785 rubles and increased by 34% compared to November 2001. In October 2002, the level of accrued average wages of health workers. physical culture and social security accounted for 56% of its level in industry, and workers in education, culture and art - 53% each. Real average wage in June 2002, compared to June 2001, it amounted to 120.1%.
Average amount of assigned monthly pensions(including compensations) in June 2002 amounted to 1341 rubles and increased by 31.6% compared to June 2001. The actual amount of accrued monthly pensions in June 2002, compared to May 2002, it amounted to 99.8%.
Monetary income of the population in June 2002, they amounted to 525.43 billion rubles. and increased compared to June 2001 by 22%, household spending- respectively 499.0 billion rubles. and 23% (26, p. 25).
For the stability of the social structure of society, it is not the fact of how much or how little the rich (poor) receive that is important, but the degree of redistribution of income between segments of the population. In terms of the level of income distribution by population groups, Russia belongs to the group of countries with an extremely high degree of income differentiation, close to the countries of Latin America. In terms of uneven distribution of income, Russia is second only to Brazil, Chile and Mexico,
Among the indicators reflecting the level of socio-economic development of a country, a special place is occupied by an indicator that can be considered a comprehensive characteristic of the state of economic and social conditions that have developed for the life of people in a particular country. This indicator is human development index (HDI), or cumulative human development index (HDI), which was developed by specialists from the United Nations Development Program (UNDP) in 1990 on the basis of three main components that characterize human development: longevity, education, and income.
Usually, the index is the arithmetic average of the 3 most illustrative indicators of the standard of living - index of achieved education of the population, life expectancy index at birth And index of real per capita GDP, calculated taking into account the purchasing power parity (PPP) of the currencies of different countries. Some authors include four components in the HDI: they add adult literacy rate And average years of schooling in the country, i.e. completeness of enrollment in primary, secondary and higher education (instead of the education level index). Noteworthy are the opinions of some authors (regarding the inclusion of the infant mortality rate in the calculation of the component reflecting life expectancy.
The Human Development Index is measured using relative indicators, which are expressed in the range from 0 to 1. At the same time, a maximum and a minimum are set for each of the three components, and the actual situation is correlated with these criteria. For the first of the components - life expectancy at birth- adopted at a minimum of 25 years and a maximum of 85. The second component indicator - accessibility of education– is calculated from the following subcomponents:
but) adult literacy(in %) - the minimum value is 0, the maximum is 100%;
b) average duration of study calculated as the sum of the number of years of education (for those with higher, incomplete higher, secondary special, secondary general, incomplete secondary, those without incomplete secondary education) per 1000 adults and per 1 person;
in) summary indicator of access to education is calculated by weighting the literacy rate (with a share of two-thirds) and the average years of schooling (with a share of one-third).
The third component indicator is the adjusted average annual income (in US dollars). The minimum value of the indicator is $200, the maximum is $40,000.
The Human Potential Index allows countries (and regions) to be ranked based on a comparison of the actual situation with the best and worst achievements. The value of the index can vary from 0 to 1, while the closer it is to 1, the higher the development of human potential and, consequently, the higher the socio-economic standard of living in the country. Countries with an HDI value greater than or equal to 0.800 are classified as countries with a high level of human development. The group of countries with medium and low levels of human development includes, respectively, countries with HDI values ranging from 0.500 to 0.799 and less than 0.500.
An analysis of trends in economic growth rates and social components of the HDI shows that over the past decade, life in many countries of the world has become more prosperous. Of the 174 countries for which the UN Human Development Index is calculated, in most states the average life expectancy has increased, the proportion of the population receiving education has increased, and positive trends in GDP dynamics have been observed.
According to UNDP estimates, in 1997 Canada, Norway and the United States ranked top three in HDI. The top ten states with the highest human development index, in addition to the above, included (according to 1997 data) Japan, Belgium, Sweden, Australia, the Netherlands, Iceland and the UK (see Tables 7, 8). Rounding out the list were the countries with the lowest levels of human potential - Ethiopia, Niger and Sierra Leone, whose development rates are almost three times lower than in the top ten countries. The marked deterioration in living conditions in several African countries is due to increased political conflict, declining incomes and the spread of the AIDS epidemic. Some states of Eastern Europe and the CIS countries are in a difficult situation, in which fundamental economic transformations are taking place. The CIS states in this list are as follows: Belarus - in 60th place, Russia - in 71st, Kazakhstan - in 76th, Georgia - in 85th, Armenia - in 87th, Ukraine - in 91st, Uzbekistan - in 92nd, Turkmenistan - in 96, Kyrgyzstan - 97, Azerbaijan - 103, Moldova - 104, Tajikistan - 108.
According to UNDP estimates, the HDI in Russia for the period 1992-96 down over 40 points. Our country moved from 26th place (1990) to 67th (1996), and in 1997 - to 71st place, essentially closing the group of countries with an average level of human potential. According to the UNDP, in 2001 Russia moved up to 60th place. Norway became the leader in terms of human development, while the United States dropped to 6th place. Some improvement in the situation was also observed in a number of Eastern European and CIS countries: the Czech Republic ranked 33rd, Hungary - 35th, Slovakia - 36th, Poland, Estonia, Lithuania, Latvia and Belarus - 37th, 42nd, 49th, 53rd and 56th places respectively. In terms of life expectancy (a little over 65 years), Russia in 1999 ranked 100th out of 162 countries.
Prokushev E.F., Likhonin E.P.
Key indicators of quality of life
The concept of "quality of life" is a complex derivative of historical, geographical, economic, social and other factors that determine the position of a person in society. In the practical application of the concept of quality of life, it is necessary to distinguish between the concepts of "quality of life", "way of life", "conditions" and "standard of living". The quality of life shows the effectiveness of people's lifestyle. The level and conditions of life are structural components of the quality of life.
The methodology for assessing the level and quality of life of the population is an important analytical tool for the state socio-economic policy, which allows you to: establish guidelines for the state's socio-economic policy for the future; to analyze the current level of socio-economic development of the country; assess the level of poverty; conduct inter-regional comparisons of the level and quality of life of the population.
At the present stage of development of the Russian economy, the problems of the standard of living of the population and the factors that determine its dynamics become very important. The direction and pace of further transformations in the country and, ultimately, political and, consequently, economic stability in society, largely depend on their solution. The solution of these problems requires a certain policy developed by the state, the central point of which would be a person, his well-being, physical and social health. That is why all the transformations that one way or another can lead to a change in the standard of living are of great interest to a wide variety of segments of the population.
The transition to market relations has introduced significant changes in the regulation of income, which primarily determine the well-being of people. First of all, the role of the state in this area has decreased, the independence of regions and enterprises has expanded, and the importance of market regulators has also increased. That is why it becomes so important to develop an enterprise's own policy in the field of income, which would take into account the interests of various groups of workers and owners, would provide for an effective system of employment and remuneration for work, measures for the social protection of workers, and, therefore, would provide a person with a decent life.
Often the concept of the standard of living is identified with such concepts as "welfare", "way of life" and others, but the essence of the standard of living is most fully revealed by the following definition.
The standard of living is a complex socio-economic category that reflects the level of development of physical, spiritual and social needs, the degree of their satisfaction and the conditions in society for the development and satisfaction of these needs.
The standard of living is determined by a system of indicators, each of which gives an idea of any one side of a person's life.
There is a classification of indicators according to individual characteristics: general and particular; economic and socio-demographic; objective and subjective; cost and natural; quantitative and qualitative; indicators of the proportions and structure of consumption; statistical indicators, etc.
General indicators include the size of the national income, the consumption fund of national wealth per capita. They characterize the general achievements of the socio-economic development of society.
Particular indicators include working conditions, housing and household amenities, the level of socio-cultural services, etc.
Economic indicators characterize the economic side of the life of society, the economic possibilities of meeting its needs. This includes indicators that characterize the level of economic development of society and the welfare of the population (nominal and real incomes, employment, etc.).
Socio-demographic indicators characterize the sex and age, professional and qualification composition of the population, the physical reproduction of the labor force.
The division of indicators into objective and subjective is associated with the justification of changes in people's life activities and are divided depending on the degree of subjectivity of the assessment.
Cost indicators include all indicators in monetary form, and natural indicators characterize the volume of consumption of specific material goods and services in physical terms.
To characterize the standard of living, quantitative and qualitative indicators are of great importance. Quantitative ones determine the volume of consumption of specific material goods and services, and qualitative ones determine the qualitative side of the population's well-being.
As independent indicators, one can single out indicators that characterize the proportions and structure of the distribution of the population's welfare. An important role in determining the standard of living is played by statistical indicators, which include general indicators, indicators of income, consumption and expenditure, monetary savings, accumulated property and housing, and a number of others.
The above indicators only allow us to assess the current situation, identify past trends, and transfer them to the future, but they do not allow us to accurately predict the dynamics of living standards. This can be done only with a detailed analysis of the conditions (factors) that influence and even determine possible changes in the standard of living of the country's population. As mentioned above, these factors are usually divided into groups.
The most significant factors that can radically influence the change in the standard of living of the population are political ones. They include the nature of the social (state) system, the stability of the institution of law and the observance of human rights, the ratio of various branches of government, the presence of opposition, various parties, and so on.
A strong influence on the standard of living of the population is exerted by economic factors, which include the presence of economic potential in the country, the possibilities for its implementation, and the amount of national income. The standard of living in the country can also be judged by the ratio of the wealthy to the poor. In world practice, two main forms of poverty are distinguished: absolute - in the absence of income necessary to meet the minimum living needs of an individual or family, and relative - when income does not exceed 40-60% of the average income in the country.
The level and dynamics of labor productivity is also an important factor in the growth of GDP and national income, and hence the standard of living changes depending on the dynamics of labor productivity. In turn, labor productivity depends on the development of scientific and technical progress, the improvement of labor organization, production and management, and socio-economic factors.
The development of the social sphere (science, education, healthcare, culture) determines the satisfaction of the social needs of the population, contributes to the development of the nation's intellect, affects the economic health of society, and so on.
In addition to those discussed above, the factors that determine the standard of living include: working conditions, leisure conditions, social security, social conditions (including environmental conditions, crime rates, etc.), personal savings.
The issues of organization of payment and material incentives for labor are closely related to the concept of "standard of living of the population". Wages are the main source of income for the vast majority of the population, and the amount of real wages largely determines the financial situation of people.
The standard of living of the population is determined, on the one hand, by the composition and magnitude of the needs for various life goods (food, clothing, housing, transport, various utilities and household services, education, medical care, cultural and educational events, etc.), with the other is the possibility of satisfying them, based on the offers on the market for goods and services and the real incomes of people, their wages. In turn, the size of real wages and the standard of living of the population are determined by the degree of production efficiency based on the use of scientific and technological progress, the scale of development and quality of the service sector, and the educational and cultural level of the population.
The indicators of the standard of living of the population that are directly related to the organization of wages and the establishment of its minimum size include such concepts as the food and consumer basket, the subsistence minimum, and the subsistence minimum budget.
A food basket is a set of foodstuffs per person per month, calculated on the basis of minimum food consumption norms that correspond to the person's physical needs, calorie content, content of essential nutrients and ensure adherence to traditional eating habits (table 1).
Table 1.
A set of food products for socio-demographic groups of the population at the subsistence level
(kg per year)
Main types of food products Average per capita Men Women Pensioners Children
16-59 years old 16-54 years old Under 6 years old 7-15 years old
Bread and bakery products 130.8 177 124.9 119 64.4 112.3
Potatoes 124.2 160 120 90 85 135
Vegetables and melons 94 80.8 96.8 96.8 85 120
Fruits and berries 19.4 14.6 12.6 10.6 34.4 44.4
Sugar and confectionery 20.7 20.8 19.8 18.8 19.7 26.1
Meat and meat products 26.6 32.2 25 19.8 18.7 33.5
Fish and fish products 11.7 12.7 10.7 12.7 8.7 12.5
Milk and dairy products 212.4 201.7 179.4 174.1 279 303.4
Eggs, pcs. 51.4 180 150 90 150 180
Vegetable oil and margarine 10 11.2 9.8 8.9 6.8 11.7
According to the specialists of the Institute of Nutrition, this set of products meets the physical needs of a person in terms of calorie content and the content of basic nutrients. The composition of the minimum set of food products does not include alcoholic beverages, tobacco products, delicacies.
Living wage and living wage budget (BPM) indicators are used by the state as social policy instruments. In particular, with the help of these indicators, the standard of living of the population is assessed (the shares of the population with budgets lower, equal and greater than the subsistence minimum budget are determined). The BPM serves as the basis for targeted social policy in order to support the lowest income groups of the population; the BPM should determine the minimum wage and minimum old-age pension; BPM is used as one of the criteria for low income, giving the right to social payments and benefits.
As experience shows, any quantitative estimates for each of the above factors and for them as a whole are practically impossible. These living conditions are directly dependent on the total resources available in the country for consumption and accumulation, most fully measured by GDP.
Literature:
1. Animtsa E.G., Yolokhov A.N., Sukhikh V.A. The quality of life of the population of the largest city. Part 1 - Yekaterinburg: Publishing House of the Ural State Economic University, 2000. - 262 p.
2. Glushakova O.V. The evolution of methodology and theory of quality of life in the concepts of foreign and domestic scientific schools [Text] / O.V. Glushakova / / Bulletin of KuzGTU. - 2006. - No. 3. - P.141-147.
3. Glushakova O.V. Reproduction of the quality of life: forms of modification and their interaction [Text] / O.V. Glushakova // Bulletin of KuzGTU. - 2006. - No. 4. - P.129-133.
4. Levashov V.I. Social policy of income and wages - M: Center for Economics and Marketing, 2000. - 360 p.
5. Economic and social problems of Russia. Shadow economy: economic and social aspects. / Ed. Zhilina I.Yu., Timofeev L.M. - M: B., 1999 - 168 p.